Digital Filtering of an ECG Signal
Hello everyone, Today, I will show how can you filter out the noise from the raw ECG signal. Let’s start!
What is ECG?
Electrocardiography (ECG) is the measurement of the bioelectrical activity during the contraction and relaxation stages of the atria and ventricles of the heart, the stimulation of the heart and the conduction of the stimulus. ECG signal has some specific waves which correspond to particular conditions.
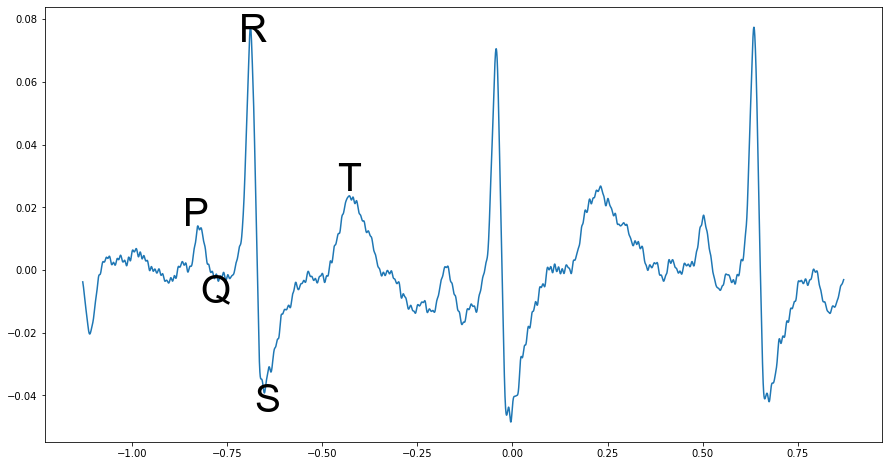
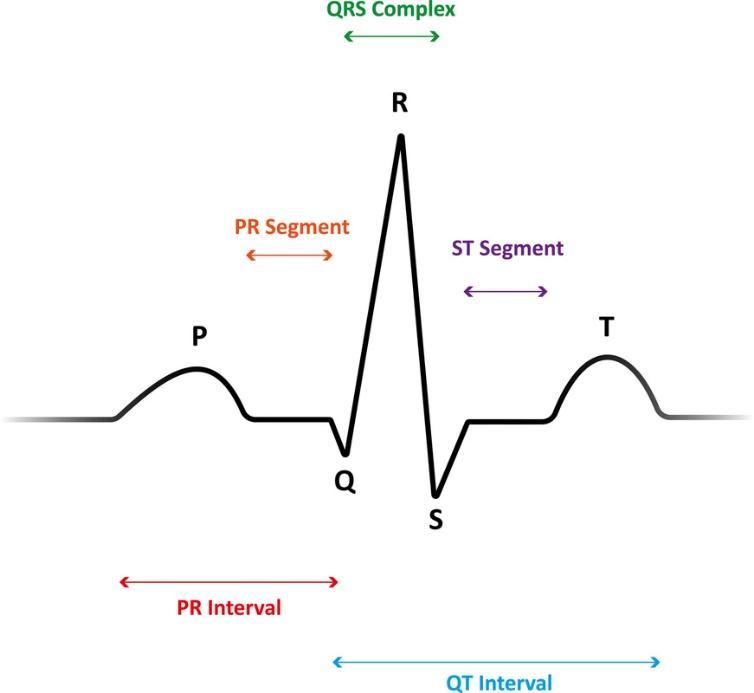
Part of the ECG Signal
ECG Circuit
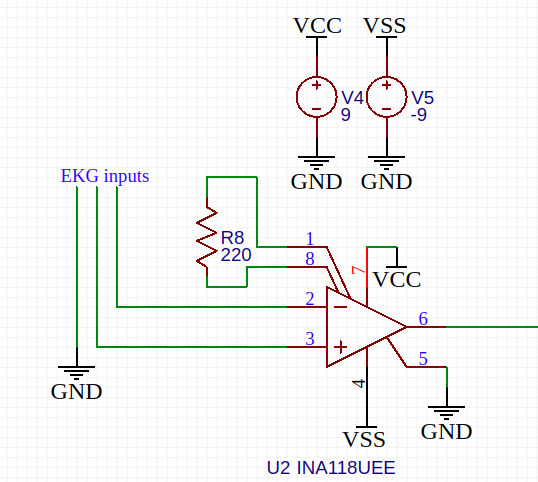
During this process, a 9V battery was used as a source to prevent leakage current through the person to whom the electrodes were connected and the sockets to which the oscilloscopes were connected were checked. Also, in case of any leakage, the person was allowed to separate his feet from the floor with the help of the plastic chair he was sitting during the experiment and not to be in physical contact with any person. The electrode attached to the right leg is connected to the low-potential end (ground) of the battery as shown in the figure above. The remaining two electrode terminals were connected to the negative and positive input terminals on pins 2 and 3 of the INA118. A quite simple circuit is created. It is shown in the next image. It basically consists of 3 components: 2 x 9V battery, instrumentation amplifier INA118 with proper connection and a gain resistor, and electrode connections. The circuit is not the main focus of this post. For further information please send me an email. In this post, I will focus on digital filters that can be used to filter out the noise from the ECG signal.
ECG Circuit Schematic
Cleaning Noise
Scope image of the output signal of the ECG circuit
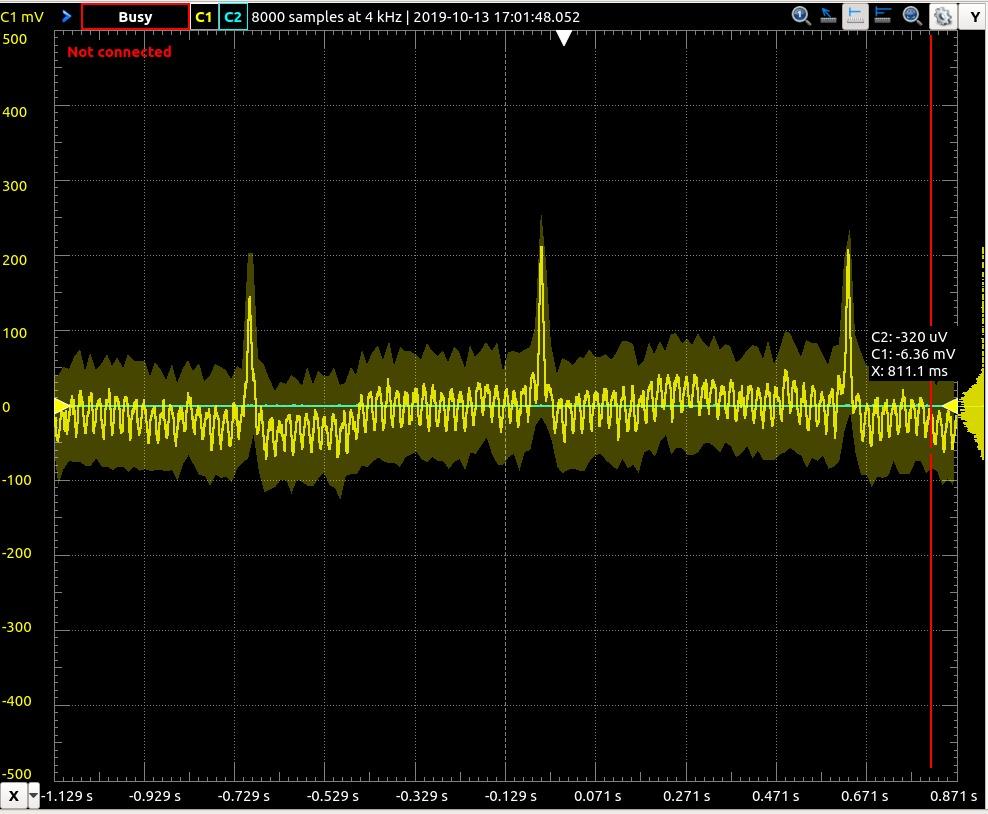
The output of the circuit sampled using a digital oscilloscope and then it is exported as CSV file. The file consists of 8000 samples for 2 seconds time window which means 4 kHz sampling frequency. The raw oscilloscope output can be examined from the next figure.
Raw ECG Data
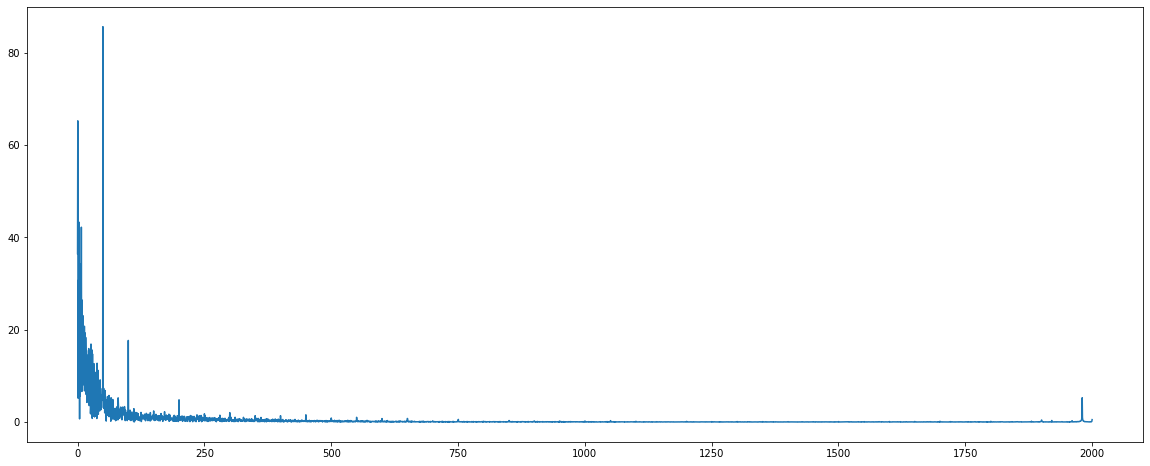
First, the frequency domain components of the ECG data are examined. FFT transform is applied to data and its frequency components are plotted in the next figure. Since the Nyquist theorem says that maximum frequency can be measured is half of the sampling frequency, the max frequency component is 2 kHz.
0 - 2 kHz Frequency Spectrum
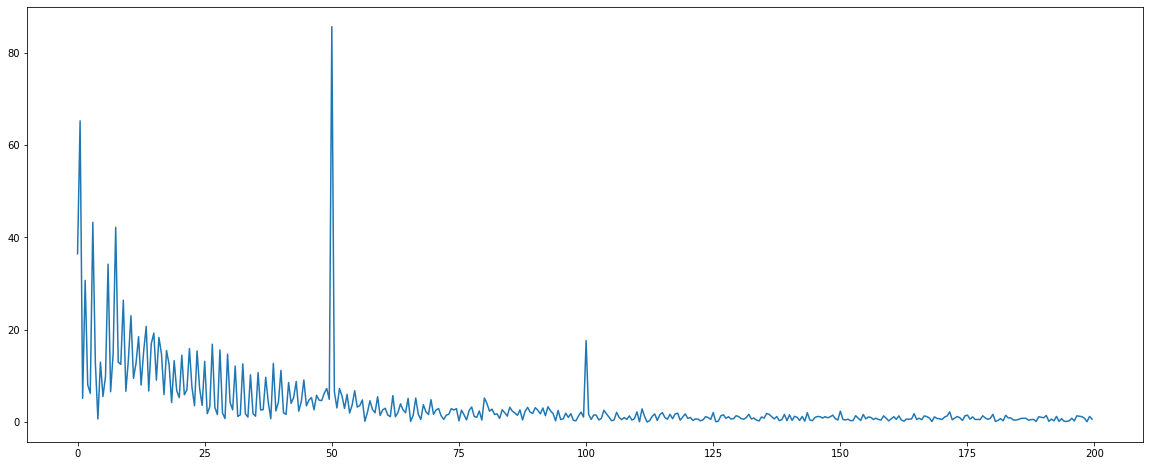
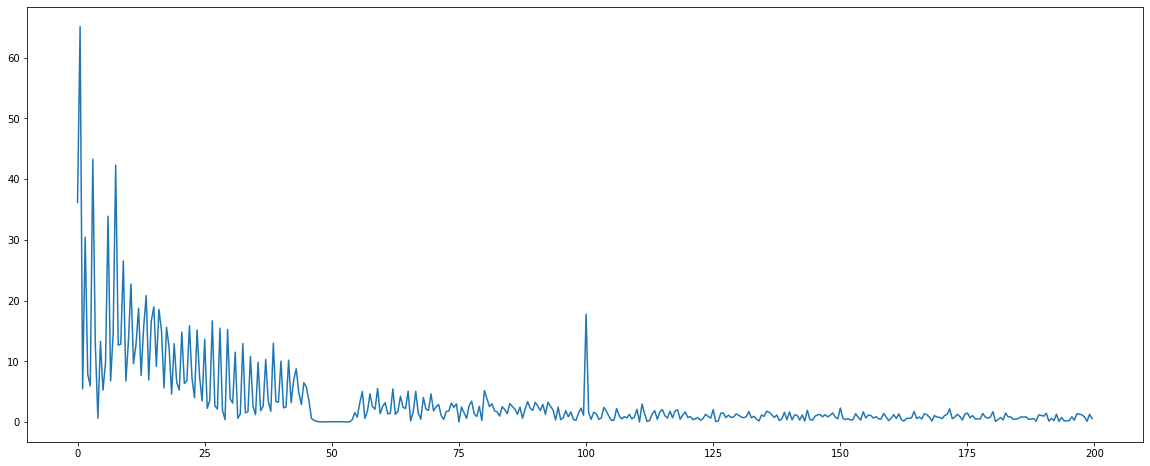
In the next figure, the plot is zoomed to frequency components between 0 - 200 Hz. As you can see from the plot, there is a big noise component at 50 Hz frequency because of the mains electricity. It should be filtered for a cleaner ECG signal.
0 - 200 Hz Frequency Spectrum
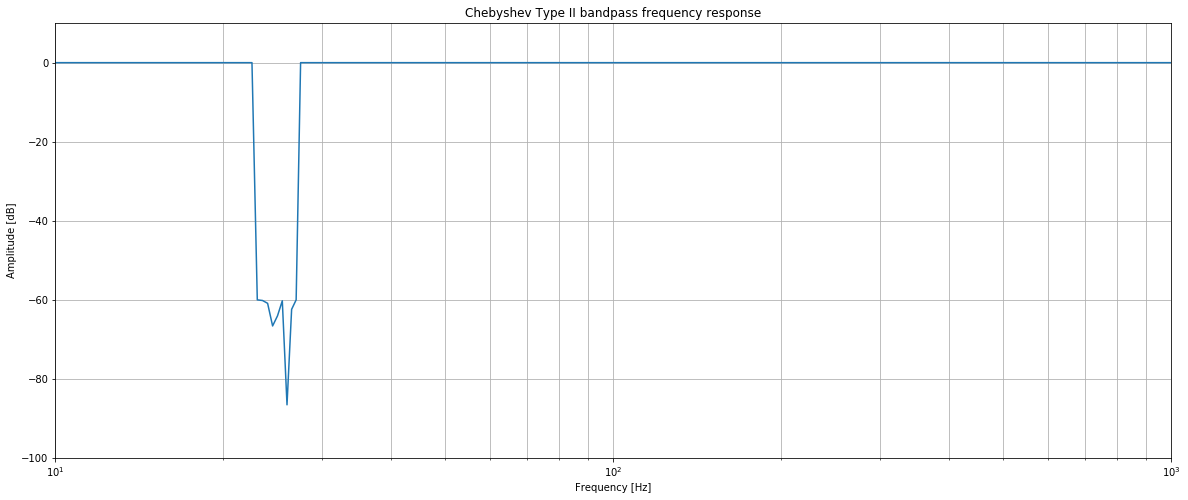
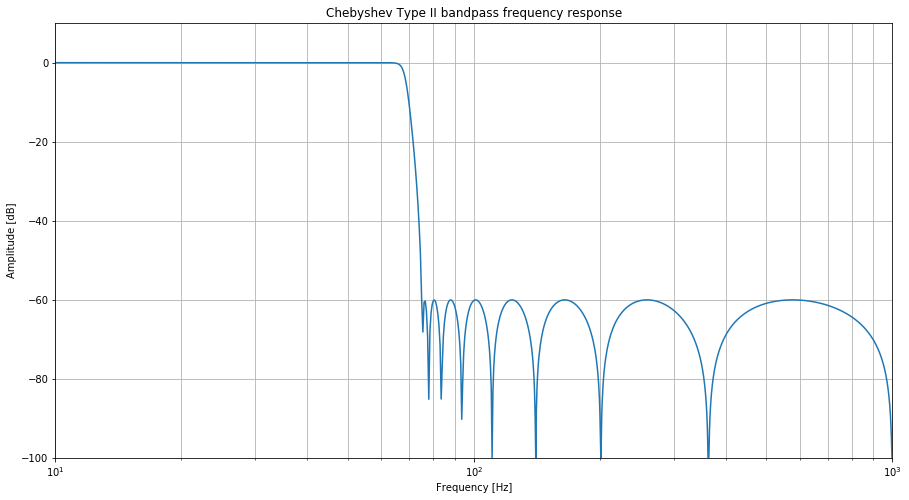
A digital IIR filter is designed to filter out a 50 Hz frequency component. It is a Chebyshev Type 2 filter with 16 filter coefficients. It provides -60 dB gain between 47 - 53 Hz.
50 Hz Band Stop Filter
After the filtering, the frequency domain components are examined again. The noise component at 50 Hz is removed from the signal.
Frequency Domain Result
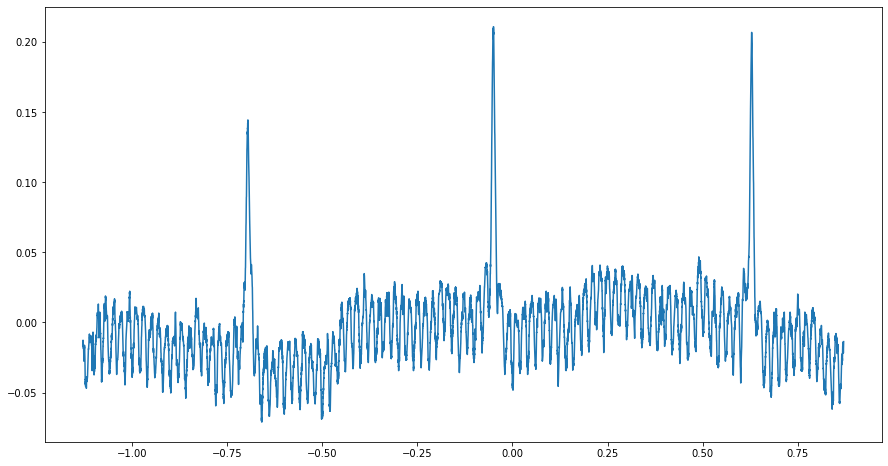
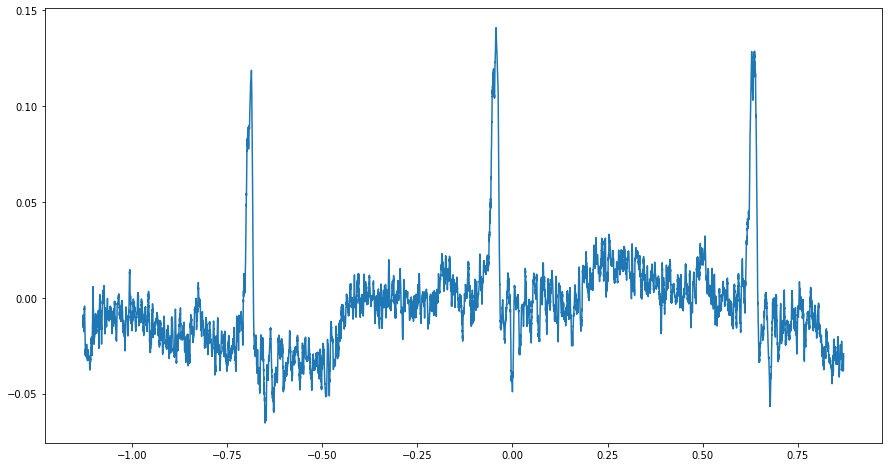
The time-domain result of the filter can be examined in the next figure. As you can see from this figure, the time domain components of the ECG is cleaner.
Time Domain Result
The next filter is designed to remove high-frequency noise from the signal. For this purpose, a 0-200 Hz low pass filter is designed.
0 - 200 Hz Low Pass Filter
Time Domain Result
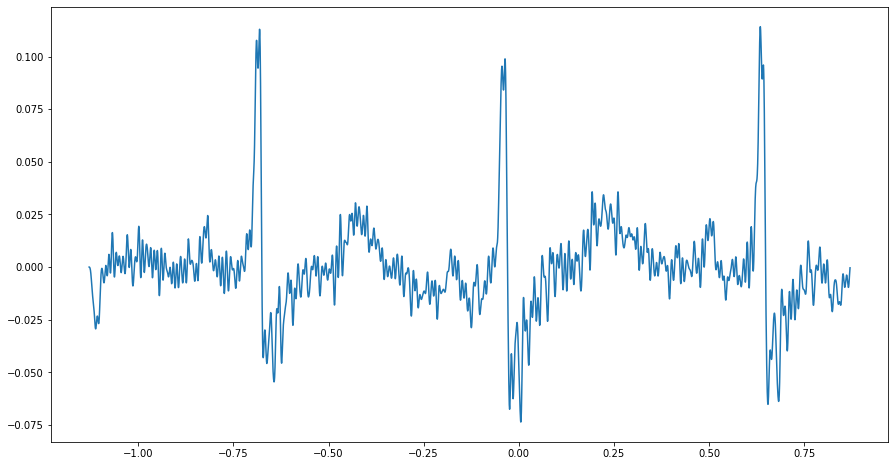
Finally, A simple moving average filter is applied to the signal. The next figure is the final result of our ECG project. After the filtering operations, most of the ECG components are cleaner and now it is easier to extract ECG components from the signal.
100 Point Simple Moving Average Filtered Signal